Logs
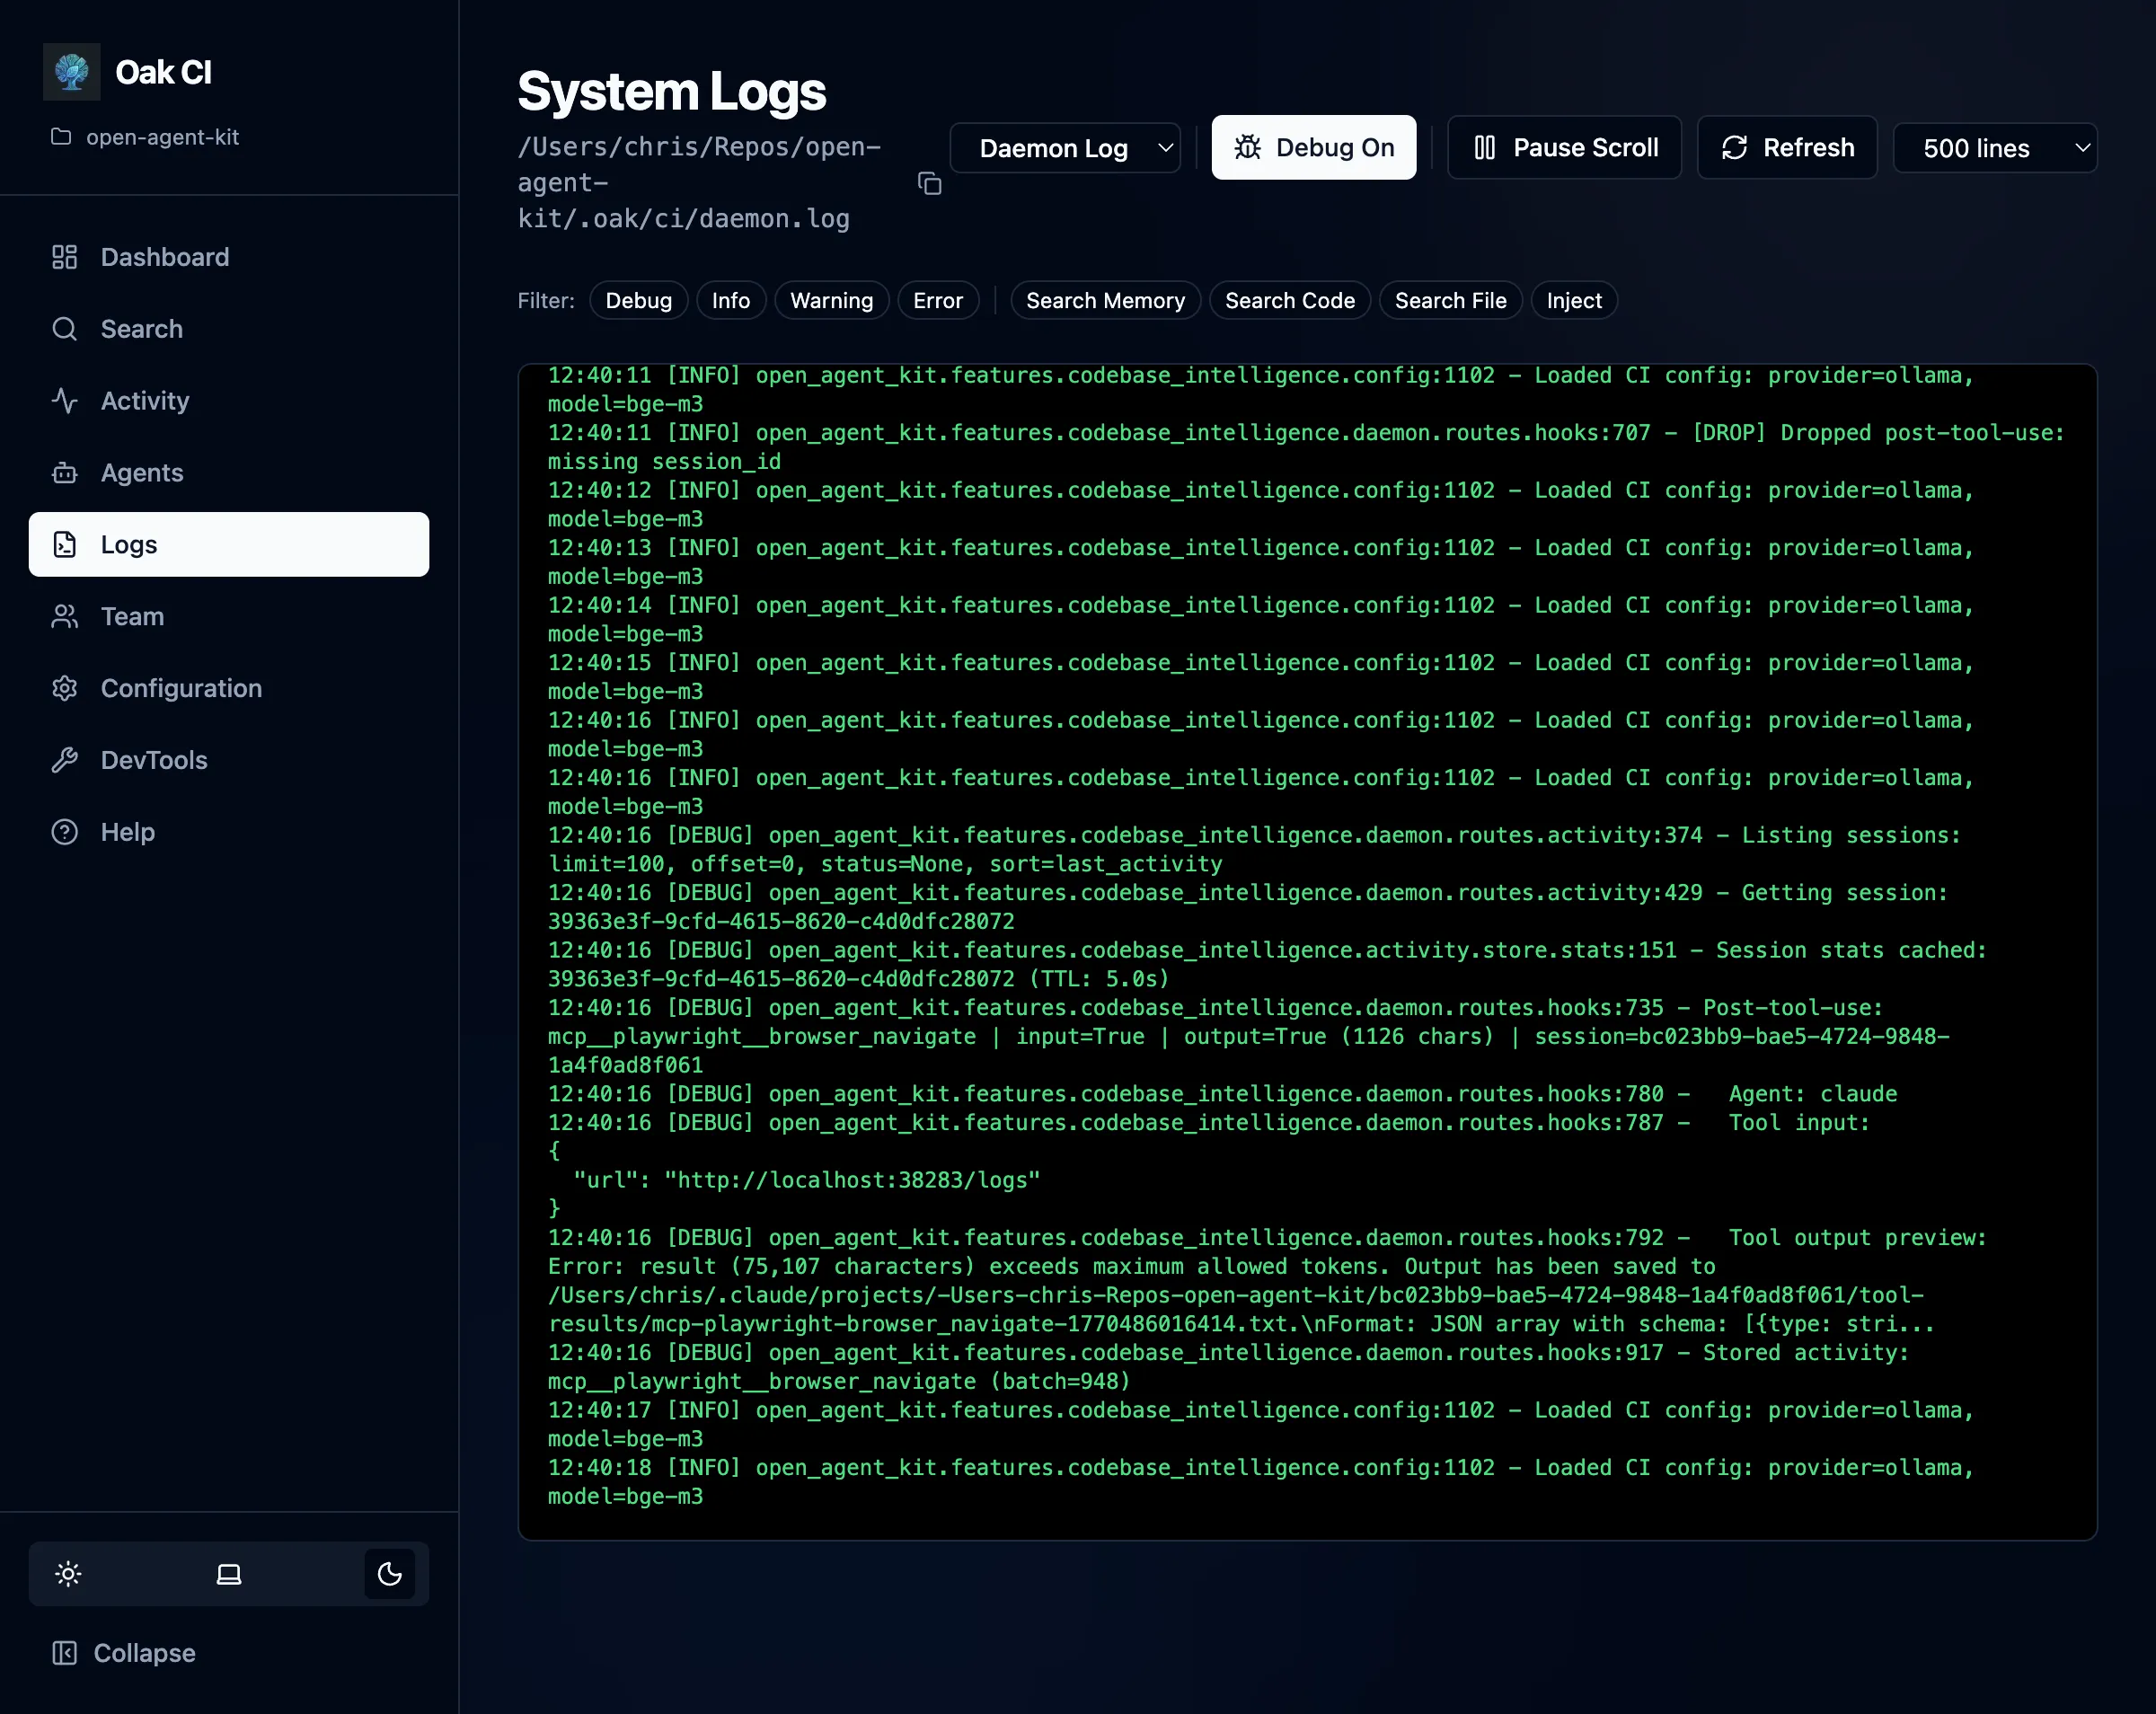
The Logs page provides a comprehensive log viewer for verifying daemon behavior and debugging issues.
Log Files
Section titled “Log Files”OAK maintains two separate log files:
| Log | Purpose |
|---|---|
| Daemon log | Main server activity — indexing, background jobs, API requests, errors |
| Hooks log | Agent activity tracking — session starts, prompt captures, tool executions, session completions |
Switch between logs using the tabs at the top of the page.
Features
Section titled “Features”Live Scrolling
Section titled “Live Scrolling”Logs stream in real time as the daemon works. Auto-scroll keeps you at the bottom to see the latest entries. When you scroll up to inspect an older entry, auto-scroll pauses so you can read and copy without the view jumping away.
Tag Filters
Section titled “Tag Filters”Log entries are tagged by category (e.g., indexer, hooks, background, search, config). Use the tag chips at the top of the log viewer to filter entries:
- Click a tag to show only entries with that tag
- Select multiple tags for OR-logic filtering (shows entries matching any selected tag)
- Click again to deselect
Debug Mode
Section titled “Debug Mode”Toggle the Debug switch to enable DEBUG level logging. This restarts the daemon with verbose output — useful for diagnosing issues with embedding providers, background processing, or hook execution.
Line Limits
Section titled “Line Limits”Configure how many log lines to display (100–5000) to balance between history and performance.
CLI Alternative
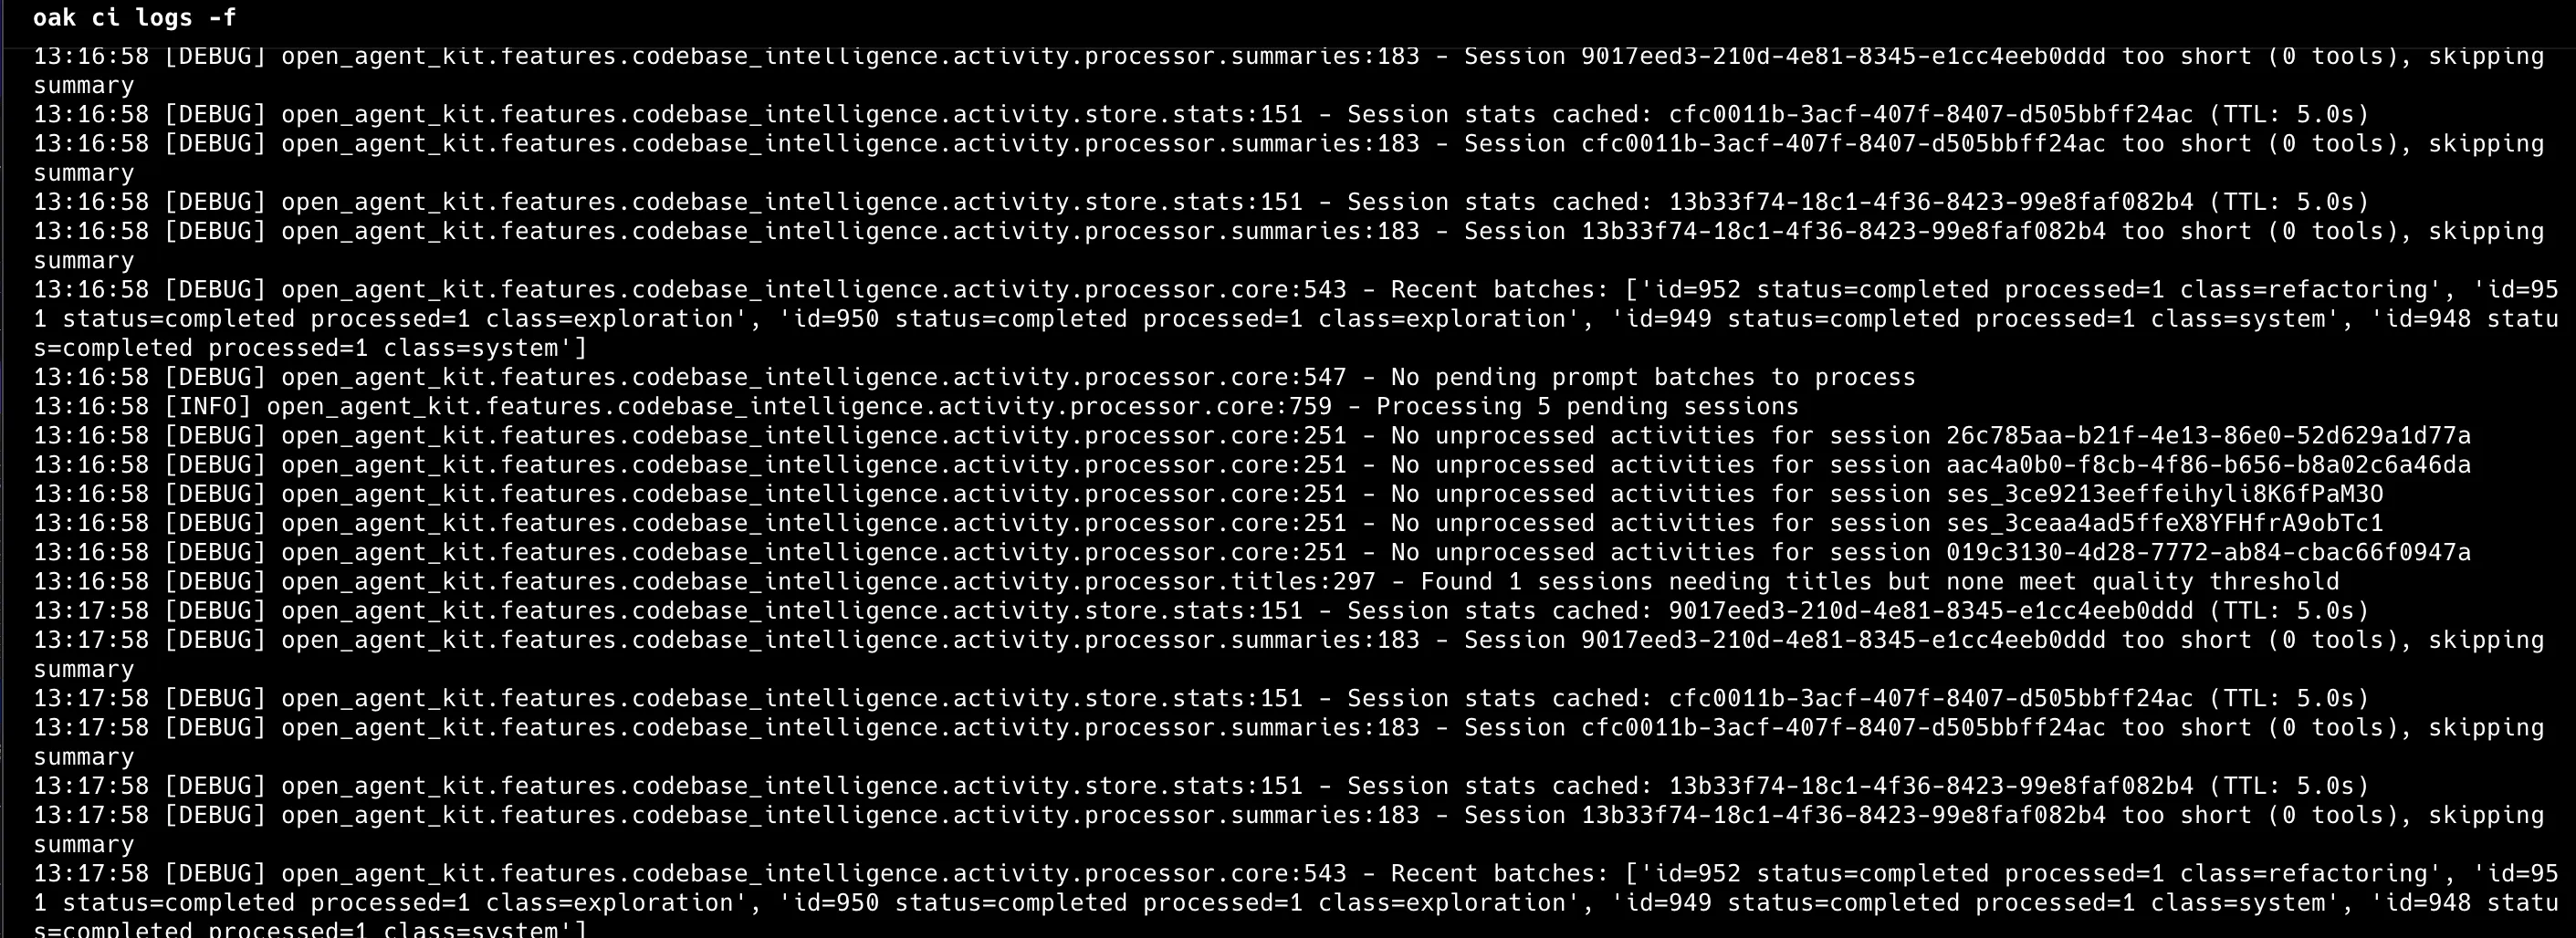
Section titled “CLI Alternative”You can also follow logs from the terminal:
oak ci logs -f # Follow daemon logs