Dashboard
The dashboard is your primary interface to OAK after initial setup. It provides a visual interface to everything the daemon tracks — code search, agent activity, project memory, configuration, and more.
Open the dashboard: Run oak ci start --open, or navigate to http://localhost:{port}/ui (use oak ci port to find the port).
Dashboard Home
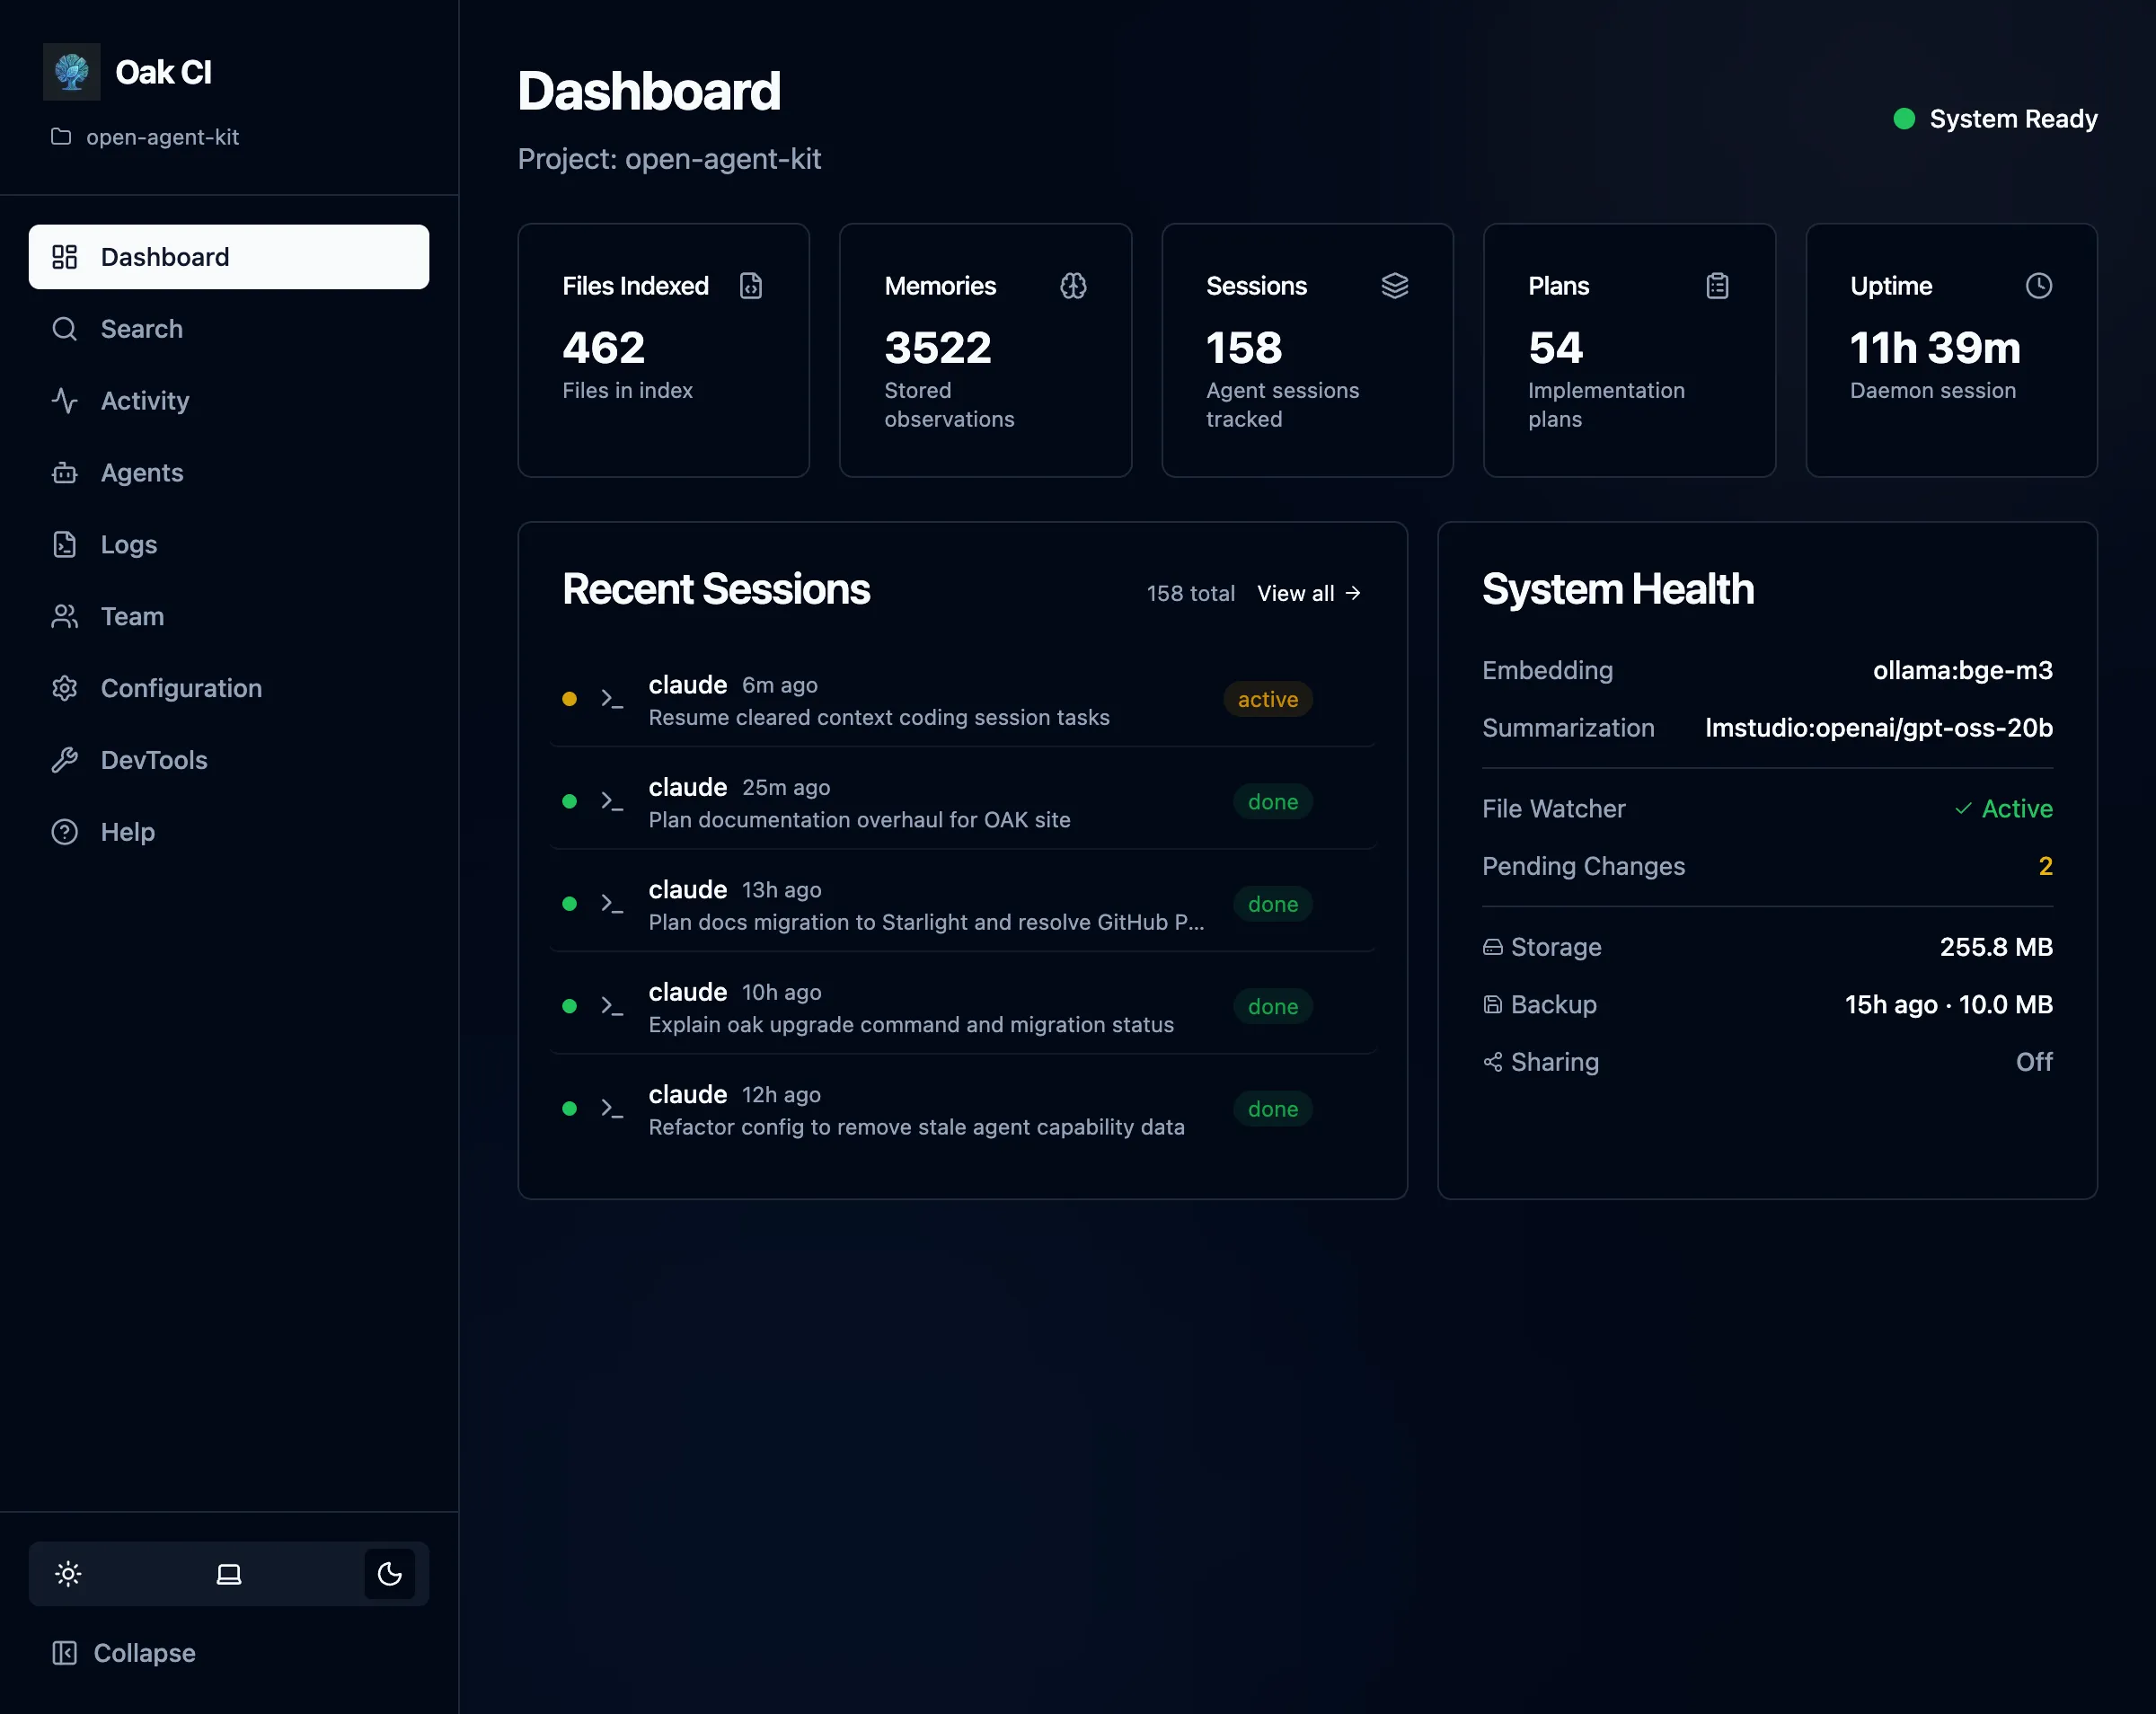
Section titled “Dashboard Home”The home page gives you an at-a-glance view of your project:
- Files Indexed / Memories / Sessions / Plans — Key metrics as clickable cards
- Recent Sessions — Your latest agent interactions with status indicators
- System Health — Embedding provider, summarization model, file watcher status, storage usage, and backup info
Search
Section titled “Search”Test and explore semantic search across your entire codebase, memories, and plans.
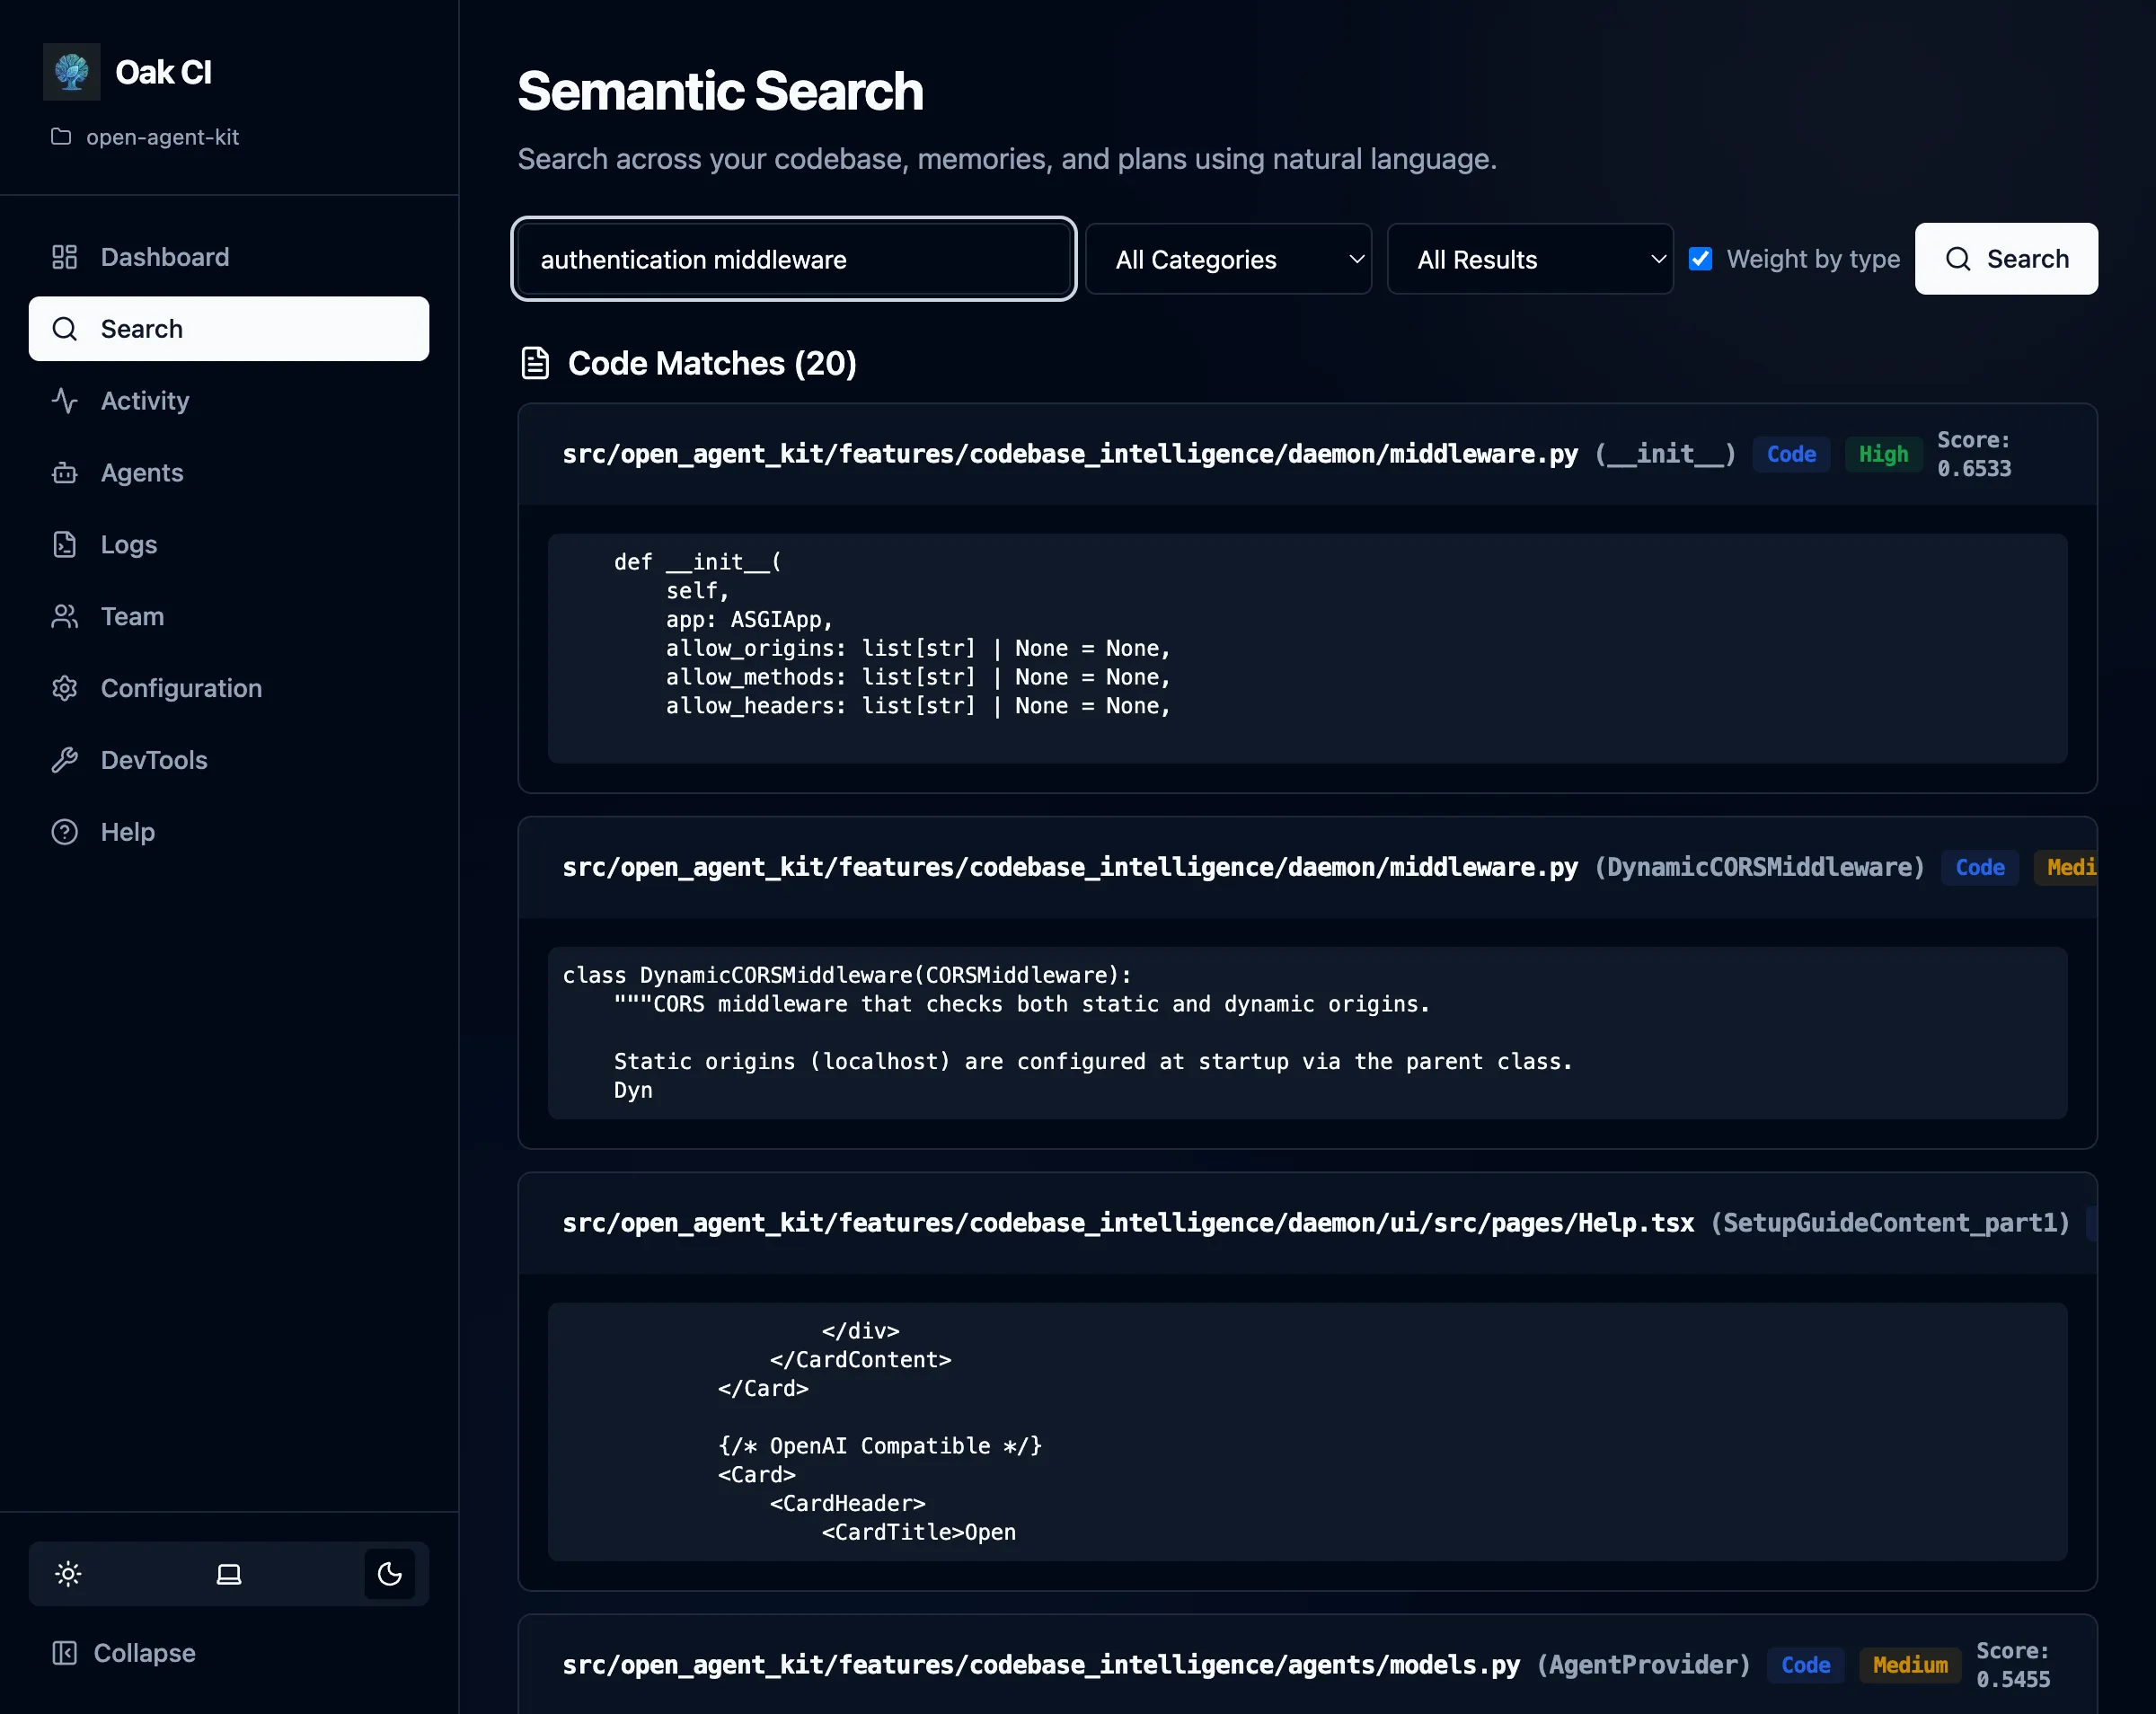
- Natural language queries — Ask questions like “How is authentication handled?” or “Where are database migrations?”
- Category filters — Search across All, Code Only, Memories Only, Plans Only, or Sessions Only
- Confidence levels — Filter by High, Medium, or Low confidence results
- Weighted results — Toggle type-weighted scoring to prioritize the most relevant category
Feature Pages
Section titled “Feature Pages”Each major dashboard feature has its own dedicated page in the sidebar. Here’s a quick overview of what’s available:
| Page | What it does |
|---|---|
| Activities | Browse sessions, plans, and memories with filtering and bulk actions |
| OAK Agents | View built-in agents, run tasks, create custom tasks |
| Logs | Live log viewer for daemon and hooks activity |
| Teams | Backup, restore, sync, and share with teammates |
| Configuration | Models, session quality, logging, exclusions |
| DevTools | Stats, maintenance, index rebuilds, cleanup |
UI Features
Section titled “UI Features”- Light/dark mode — Toggle between themes using the sun/moon icon
- Collapsible sidebar — Collapse the navigation sidebar to maximize content area
- Built-in Help — Click Help in the sidebar for task-oriented guides